> ## Documentation Index
> Fetch the complete documentation index at: https://docs.eat-now.io/llms.txt
> Use this file to discover all available pages before exploring further.
# Dashboard statistics
> Understand every number on your performance dashboard — covers, occupancy rate, no-show rate, returning clients and more — including how each metric is calculated and what counts towards it.
Your **Dashboard** is the home page of EatNow. It gathers your restaurant's key figures in one place so you can see, at a glance, how a day, a week or a season went — and how it compares to the period before.
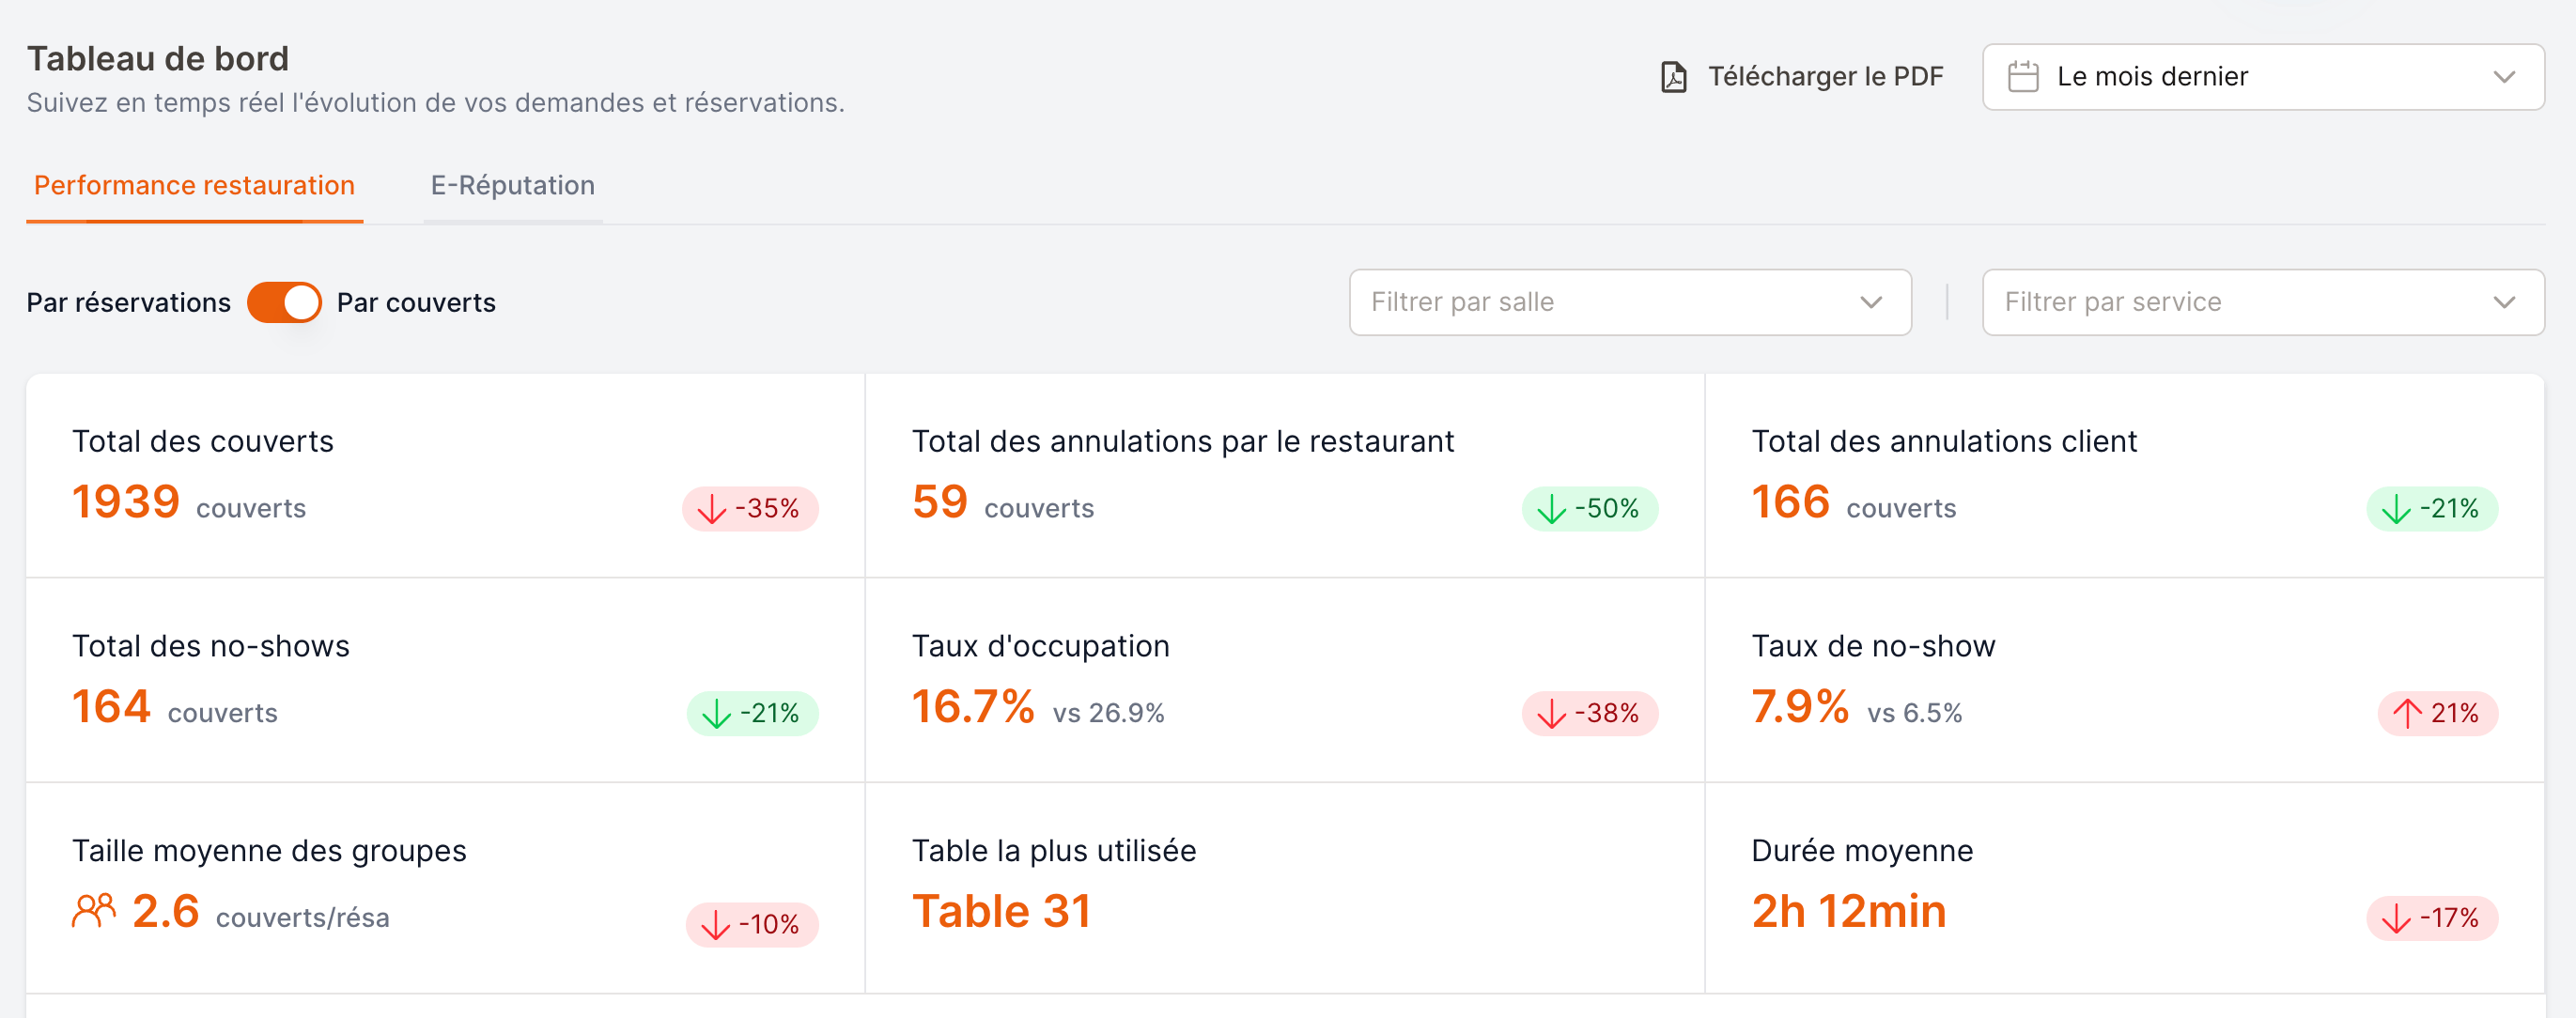 This guide explains **what each statistic means** and, for the trickier ones, **exactly how it is calculated** and **which reservations count towards it**.
Some numbers can look surprising until you know the rules behind them (for example, why a cancelled booking still affects your no-show rate, or why average duration only counts finished meals). This page is here to remove that doubt.
***
## Before you read the numbers
A few controls at the top of the dashboard change **every** statistic below them. Always check these first.
### Date range and comparison
Pick a period from the date selector (Today, This week, Last month, a custom range…). Every figure is computed for that period.
Most cards also show a **comparison** against another period. By default this is the **period immediately before** of the same length — for example, if you select *Last week*, each card compares it to the week before that. The comparison range is always shown next to the date selector so you know exactly what you are comparing against.
You can change the comparison with the **Compared to** selector:
| Option | What it compares against |
| ------------------- | --------------------------------------------------------------------- |
| **Previous period** | The equivalent period immediately before your selection (the default) |
| **Previous year** | The exact same dates, one year earlier |
| **Custom** | A range you pick yourself from the calendar |
**Services that run past midnight count towards the day they started on.** A cover served at 00:30 during the service of the 12th is counted on the **12th**, not the 13th — the same way your reservations list works.
A day therefore rolls over at **6am**, not at midnight. Between midnight and 6am, *Today* still means the service in progress, and the date picker spells the date out (for example **Today · 12 Jul**) so there is no ambiguity.
The small coloured badge on a card is the **percentage change** versus the comparison period:
| Badge | Meaning |
| ---------------------------------- | ---------------------------------------------------------------------- |
| Green | The metric went **up**, and up is good here (e.g. more covers) |
| Red | The metric went **down**, and down is bad here |
| Yellow | No change, or there was no data in the previous period to compare with |
For some metrics, **higher is worse** — no-shows, cancellations, lost payments and arrival delay. On those cards the colours are **inverted**: an increase shows red, a decrease shows green. The number always tells you the direction; the colour tells you whether that direction is good for you.
### By covers vs. by reservations
A switch lets you count either:
* **By covers** — the number of **guests** (the sum of every party size).
* **By reservations** — the number of **bookings**, regardless of party size.
A single booking for a table of 6 counts as **6 covers** or **1 reservation** depending on this switch.
### Shift and room filters
You can narrow the whole dashboard to a single **shift** (e.g. only Dinner) or a single **room**. Leave them on *All* to see the full picture.
### The three tabs
| Tab | What it covers |
| -------------------------- | ---------------------------------------------------------------------- |
| **Restaurant performance** | Reservations, occupancy, no-shows, payments and trends for your tables |
| **Activities performance** | The same idea for bookable activities (if enabled) |
| **E-reputation** | Your Google / online rating and reviews |
***
## A quick word on reservation statuses
Several metrics depend on a reservation's **status**, so it helps to know what each one means.
| Status | Meaning |
| --------------------------------------------------------------------------------------------- | ---------------------------------------------------------------------- |
| **Pending / Pending payment** | The request hasn't been confirmed yet |
| **Confirmed** (incl. *Manually confirmed*, *Double confirmed*, *Confirmed – pending payment*) | The booking is confirmed and the guest is expected |
| **Showed up** | The guest has **arrived** (checked in) but isn't placed at a table yet |
| **Seated** | The guest is **at their table** |
| **Seated for drinks** | The guest is seated at the bar / waiting area before their table |
| **Partially seated** | Only part of the group is seated so far |
| **Done** | The meal is finished and the table has been freed |
| **No-show** | A confirmed guest never came |
| **Cancelled by user / by restaurant** | The booking was cancelled |
| **Rejected** | The request was declined |
Throughout this guide, **"attended"** means any reservation that was honoured — i.e. confirmed and not cancelled: *Confirmed, Manually confirmed, Double confirmed, Showed up, Seated, Seated for drinks, Done*. These are the bookings that represent real guests in your dining room.
***
## Restaurant performance
### Total covers
The total number of covers (or reservations) that were **attended** in the period. Cancellations and no-shows are **not** included — this is what you actually served.
### Cancellations
Two separate cards:
* **Cancelled by restaurant** — bookings you cancelled.
* **Cancelled by user** — bookings the guest cancelled.
These are *inverted* metrics: an increase is shown in red.
### Total no-shows
Covers from confirmed bookings whose guests **never arrived** (status *No-show*). Inverted metric.
### Occupancy rate
**What it tells you:** how full your restaurant was over the period.
**How it's calculated:**
```
Occupancy rate = attended guests ÷ total seating capacity for the period
```
* **Attended guests** — the sum of party sizes for all attended reservations (Confirmed, Manually/Double confirmed, Showed up, Seated, Seated for drinks, Partially seated, Done).
* **Total capacity** — your restaurant's real capacity added up day by day across the period, based on your **shifts** and **rooms** (how many guests you can physically seat).
Your restaurant can seat **100 guests per day**. Over a **5-day** week, total capacity is `100 × 5 = 500`.
If you served **375 guests** that week:
```
Occupancy rate = 375 ÷ 500 = 75%
```
Because capacity is computed from your shifts and rooms, keeping those accurate keeps your occupancy rate accurate. Filtering by a single shift or room recalculates both the guests **and** the capacity for that selection.
### No-show rate
**What it tells you:** the share of expected guests who didn't turn up.
**How it's calculated:**
```
No-show rate = no-show covers ÷ (attended covers + no-show covers)
```
The denominator is everyone who was **expected** — those who came *plus* those who didn't. Pending requests, cancellations and rejected bookings are excluded, because they were never expected to show up.
In the period you had **200 attended covers** and **10 no-show covers**.
```
No-show rate = 10 ÷ (200 + 10) = 10 ÷ 210 ≈ 4.8%
```
This is an *inverted* metric — a rising no-show rate is shown in red.
### Average group size
The average number of guests per **attended** booking, rounded to one decimal.
```
Average group size = attended covers ÷ attended reservations
```
### Most used table
The table that hosted the most covers (or reservations) in the period.
### Average duration
The average time guests spend **at the table**.
* Only reservations marked **Done** with a recorded departure time are counted (i.e. meals that actually finished and were closed out).
* Duration is measured from the **booking time** to the moment the table was **freed**.
Average duration relies on your team marking tables as **Seated** and **Done** during service. If meals aren't closed out, they don't count — so a thin number here usually means the workflow isn't being followed, not that meals were short.
### Average arrival delay
The average lateness of guests, in minutes.
* Counted from reservations that were **Seated** or **Done** and have a recorded seating time.
* Measured from the **booking time** to the **actual seating time**.
* Guests who arrive **early or on time count as 0** — early arrivals never make the delay negative.
This is an *inverted* metric — a longer delay is shown in red.
***
## Payments
If you have a payment integration active (Stripe, Payzone or CMI) and the right permission, a **Payments** section appears. Depending on whether your shifts take a deposit, you'll see either:
| Card | What it means |
| --------------------------- | ------------------------------------------------------------------------------------ |
| **Total revenue** | Payments successfully collected |
| **Total captured** | Pre-authorised amounts that were actually charged |
| **Total pre-authorised** | Amounts held on cards but not yet charged |
| **Total voided / refunded** | Amounts released or paid back to guests |
| **Total lost** | Payments that never completed — **expired, pending and cancelled** payments combined |
Revenue and captured amounts are normal metrics; refunded, voided and lost are *inverted*.
***
## Long-term performance
Below the headline cards, a set of charts shows how things evolve over time and how your bookings break down:
| Chart | What it shows |
| ---------------------------- | --------------------------------------------------------------------- |
| **Reservations over time** | The volume of bookings across the period, against the previous period |
| **Group size distribution** | How many bookings you get for parties of 1, 2, 3… |
| **Booking source** | Where bookings come from (your portal, manual entry, partners…) |
| **Day-of-week distribution** | Which days are busiest |
| **Timeslot distribution** | Which times of day are busiest |
| **Database growth** | How your saved customer database is growing |
| **Returning clients** | See below |
| **Nationality breakdown** | Where your guests come from, when known |
| **Top products** | Your most-booked items |
### Returning clients (repetition rate)
**What it tells you:** how loyal your guests are.
Among the customers who dined with you **during the selected period**, it's the share who had **already dined with you before** the period started.
```
Returning clients = customers seen before this period ÷ all customers in this period
```
This month, **120 different customers** dined with you. Of those, **42** had already visited at least once **before** this month.
```
Returning clients = 42 ÷ 120 = 35%
```
Because this looks **before** the selected period, it only makes sense with a start date — choosing a single open-ended range will show 0%.
***
## Exporting
You can download the dashboard as a **PDF** using the **Download PDF** button at the top. The export uses the same period, comparison, filters and *by covers / by reservations* setting you currently have on screen.
***
## FAQ
**Why is my occupancy rate low even though service felt full?**
Occupancy compares guests against your **whole** configured capacity for the period. If you have more shifts or rooms configured than you actually ran, capacity is higher than reality and the rate looks low. Filter by the shift or room you actually used, or review your shift capacity settings.
**Why does average duration look empty or too short?**
Only meals marked **Done** with a recorded departure are counted. If your team doesn't close tables out during service, those meals are skipped.
**A cancelled booking — does it hurt my no-show rate?**
No. Cancellations are excluded from the no-show rate entirely. Only confirmed guests who never came (status *No-show*) count.
**Why do some cards turn red when the number goes up?**
Those are metrics where higher is worse — no-shows, cancellations, lost payments and arrival delay. Their colours are inverted on purpose, so red always means "moving the wrong way".
**Covers or reservations — which should I read?**
Use **covers** to reason about how many people you served (capacity, kitchen, staffing). Use **reservations** to reason about booking volume (how many parties you handled). The switch at the top changes every count-based card at once.
This guide explains **what each statistic means** and, for the trickier ones, **exactly how it is calculated** and **which reservations count towards it**.
Some numbers can look surprising until you know the rules behind them (for example, why a cancelled booking still affects your no-show rate, or why average duration only counts finished meals). This page is here to remove that doubt.
***
## Before you read the numbers
A few controls at the top of the dashboard change **every** statistic below them. Always check these first.
### Date range and comparison
Pick a period from the date selector (Today, This week, Last month, a custom range…). Every figure is computed for that period.
Most cards also show a **comparison** against another period. By default this is the **period immediately before** of the same length — for example, if you select *Last week*, each card compares it to the week before that. The comparison range is always shown next to the date selector so you know exactly what you are comparing against.
You can change the comparison with the **Compared to** selector:
| Option | What it compares against |
| ------------------- | --------------------------------------------------------------------- |
| **Previous period** | The equivalent period immediately before your selection (the default) |
| **Previous year** | The exact same dates, one year earlier |
| **Custom** | A range you pick yourself from the calendar |
**Services that run past midnight count towards the day they started on.** A cover served at 00:30 during the service of the 12th is counted on the **12th**, not the 13th — the same way your reservations list works.
A day therefore rolls over at **6am**, not at midnight. Between midnight and 6am, *Today* still means the service in progress, and the date picker spells the date out (for example **Today · 12 Jul**) so there is no ambiguity.
The small coloured badge on a card is the **percentage change** versus the comparison period:
| Badge | Meaning |
| ---------------------------------- | ---------------------------------------------------------------------- |
| Green | The metric went **up**, and up is good here (e.g. more covers) |
| Red | The metric went **down**, and down is bad here |
| Yellow | No change, or there was no data in the previous period to compare with |
For some metrics, **higher is worse** — no-shows, cancellations, lost payments and arrival delay. On those cards the colours are **inverted**: an increase shows red, a decrease shows green. The number always tells you the direction; the colour tells you whether that direction is good for you.
### By covers vs. by reservations
A switch lets you count either:
* **By covers** — the number of **guests** (the sum of every party size).
* **By reservations** — the number of **bookings**, regardless of party size.
A single booking for a table of 6 counts as **6 covers** or **1 reservation** depending on this switch.
### Shift and room filters
You can narrow the whole dashboard to a single **shift** (e.g. only Dinner) or a single **room**. Leave them on *All* to see the full picture.
### The three tabs
| Tab | What it covers |
| -------------------------- | ---------------------------------------------------------------------- |
| **Restaurant performance** | Reservations, occupancy, no-shows, payments and trends for your tables |
| **Activities performance** | The same idea for bookable activities (if enabled) |
| **E-reputation** | Your Google / online rating and reviews |
***
## A quick word on reservation statuses
Several metrics depend on a reservation's **status**, so it helps to know what each one means.
| Status | Meaning |
| --------------------------------------------------------------------------------------------- | ---------------------------------------------------------------------- |
| **Pending / Pending payment** | The request hasn't been confirmed yet |
| **Confirmed** (incl. *Manually confirmed*, *Double confirmed*, *Confirmed – pending payment*) | The booking is confirmed and the guest is expected |
| **Showed up** | The guest has **arrived** (checked in) but isn't placed at a table yet |
| **Seated** | The guest is **at their table** |
| **Seated for drinks** | The guest is seated at the bar / waiting area before their table |
| **Partially seated** | Only part of the group is seated so far |
| **Done** | The meal is finished and the table has been freed |
| **No-show** | A confirmed guest never came |
| **Cancelled by user / by restaurant** | The booking was cancelled |
| **Rejected** | The request was declined |
Throughout this guide, **"attended"** means any reservation that was honoured — i.e. confirmed and not cancelled: *Confirmed, Manually confirmed, Double confirmed, Showed up, Seated, Seated for drinks, Done*. These are the bookings that represent real guests in your dining room.
***
## Restaurant performance
### Total covers
The total number of covers (or reservations) that were **attended** in the period. Cancellations and no-shows are **not** included — this is what you actually served.
### Cancellations
Two separate cards:
* **Cancelled by restaurant** — bookings you cancelled.
* **Cancelled by user** — bookings the guest cancelled.
These are *inverted* metrics: an increase is shown in red.
### Total no-shows
Covers from confirmed bookings whose guests **never arrived** (status *No-show*). Inverted metric.
### Occupancy rate
**What it tells you:** how full your restaurant was over the period.
**How it's calculated:**
```
Occupancy rate = attended guests ÷ total seating capacity for the period
```
* **Attended guests** — the sum of party sizes for all attended reservations (Confirmed, Manually/Double confirmed, Showed up, Seated, Seated for drinks, Partially seated, Done).
* **Total capacity** — your restaurant's real capacity added up day by day across the period, based on your **shifts** and **rooms** (how many guests you can physically seat).
Your restaurant can seat **100 guests per day**. Over a **5-day** week, total capacity is `100 × 5 = 500`.
If you served **375 guests** that week:
```
Occupancy rate = 375 ÷ 500 = 75%
```
Because capacity is computed from your shifts and rooms, keeping those accurate keeps your occupancy rate accurate. Filtering by a single shift or room recalculates both the guests **and** the capacity for that selection.
### No-show rate
**What it tells you:** the share of expected guests who didn't turn up.
**How it's calculated:**
```
No-show rate = no-show covers ÷ (attended covers + no-show covers)
```
The denominator is everyone who was **expected** — those who came *plus* those who didn't. Pending requests, cancellations and rejected bookings are excluded, because they were never expected to show up.
In the period you had **200 attended covers** and **10 no-show covers**.
```
No-show rate = 10 ÷ (200 + 10) = 10 ÷ 210 ≈ 4.8%
```
This is an *inverted* metric — a rising no-show rate is shown in red.
### Average group size
The average number of guests per **attended** booking, rounded to one decimal.
```
Average group size = attended covers ÷ attended reservations
```
### Most used table
The table that hosted the most covers (or reservations) in the period.
### Average duration
The average time guests spend **at the table**.
* Only reservations marked **Done** with a recorded departure time are counted (i.e. meals that actually finished and were closed out).
* Duration is measured from the **booking time** to the moment the table was **freed**.
Average duration relies on your team marking tables as **Seated** and **Done** during service. If meals aren't closed out, they don't count — so a thin number here usually means the workflow isn't being followed, not that meals were short.
### Average arrival delay
The average lateness of guests, in minutes.
* Counted from reservations that were **Seated** or **Done** and have a recorded seating time.
* Measured from the **booking time** to the **actual seating time**.
* Guests who arrive **early or on time count as 0** — early arrivals never make the delay negative.
This is an *inverted* metric — a longer delay is shown in red.
***
## Payments
If you have a payment integration active (Stripe, Payzone or CMI) and the right permission, a **Payments** section appears. Depending on whether your shifts take a deposit, you'll see either:
| Card | What it means |
| --------------------------- | ------------------------------------------------------------------------------------ |
| **Total revenue** | Payments successfully collected |
| **Total captured** | Pre-authorised amounts that were actually charged |
| **Total pre-authorised** | Amounts held on cards but not yet charged |
| **Total voided / refunded** | Amounts released or paid back to guests |
| **Total lost** | Payments that never completed — **expired, pending and cancelled** payments combined |
Revenue and captured amounts are normal metrics; refunded, voided and lost are *inverted*.
***
## Long-term performance
Below the headline cards, a set of charts shows how things evolve over time and how your bookings break down:
| Chart | What it shows |
| ---------------------------- | --------------------------------------------------------------------- |
| **Reservations over time** | The volume of bookings across the period, against the previous period |
| **Group size distribution** | How many bookings you get for parties of 1, 2, 3… |
| **Booking source** | Where bookings come from (your portal, manual entry, partners…) |
| **Day-of-week distribution** | Which days are busiest |
| **Timeslot distribution** | Which times of day are busiest |
| **Database growth** | How your saved customer database is growing |
| **Returning clients** | See below |
| **Nationality breakdown** | Where your guests come from, when known |
| **Top products** | Your most-booked items |
### Returning clients (repetition rate)
**What it tells you:** how loyal your guests are.
Among the customers who dined with you **during the selected period**, it's the share who had **already dined with you before** the period started.
```
Returning clients = customers seen before this period ÷ all customers in this period
```
This month, **120 different customers** dined with you. Of those, **42** had already visited at least once **before** this month.
```
Returning clients = 42 ÷ 120 = 35%
```
Because this looks **before** the selected period, it only makes sense with a start date — choosing a single open-ended range will show 0%.
***
## Exporting
You can download the dashboard as a **PDF** using the **Download PDF** button at the top. The export uses the same period, comparison, filters and *by covers / by reservations* setting you currently have on screen.
***
## FAQ
**Why is my occupancy rate low even though service felt full?**
Occupancy compares guests against your **whole** configured capacity for the period. If you have more shifts or rooms configured than you actually ran, capacity is higher than reality and the rate looks low. Filter by the shift or room you actually used, or review your shift capacity settings.
**Why does average duration look empty or too short?**
Only meals marked **Done** with a recorded departure are counted. If your team doesn't close tables out during service, those meals are skipped.
**A cancelled booking — does it hurt my no-show rate?**
No. Cancellations are excluded from the no-show rate entirely. Only confirmed guests who never came (status *No-show*) count.
**Why do some cards turn red when the number goes up?**
Those are metrics where higher is worse — no-shows, cancellations, lost payments and arrival delay. Their colours are inverted on purpose, so red always means "moving the wrong way".
**Covers or reservations — which should I read?**
Use **covers** to reason about how many people you served (capacity, kitchen, staffing). Use **reservations** to reason about booking volume (how many parties you handled). The switch at the top changes every count-based card at once.